"Nutritional Science and Healthy Diet"
"Nutritional Science and Healthy Diet"
"Nutritional Science and Healthy Diet"

Gerald C. Hsu
eclaireMD Foundation, USA
Corresponding author: Gerald C Hsu, 7 Oak Haven Way Woodside, CA 94062, eclaireMD Foundation, USA, Tel +1-510-331-5000. E-mail: g.hsu@eclairemd.com
Citation: Gerald C. Hsu (2020) Using Candlestick Charting, Segmentation Pattern Analysis, and GH- Method: Math-Physical Medicine to calculate Effective Glucoses based on Finger-Piercing Glucose Measurement. J Nut Sci Heal Diet 1(1): 1-4.
http://dx.doi.org/10.47890/JNSHD/2020/GeraldCHsu/10243805
Received Date: April 04, 2020; Accepted Date: May 05, 2020; Published Date: June 02, 2020
This paper describes glucose measurements and their extensive calculation results over a period of 7.5 years based on Finger-Piercing Data (Finger) using both candlestick charting and glucose segmentation pattern analysis. The dataset is provided by the author, who uses his own type 2 diabetes metabolic conditions control, as a case study via the “math-physical medicine” approach of a non- traditional methodology in medical research.
Math-Physical Medicine (MPM) starts with the observation of the human body’s physical phenomena (not biological or chemical characteristics), collecting elements of the disease related data (preferring big data), utilizing applicable engineering modeling techniques, developing appropriate mathematical equations (not just statistical analysis), and finally predicting the direction of the development and control mechanism of the disease.
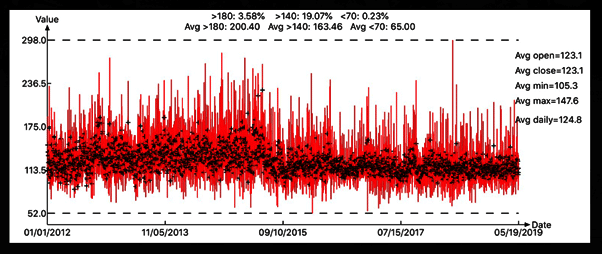
The author was diagnosed with type 2 diabetes in 1995. Since 2012, he has measured his Finger glucoses four times a day (1 FPG and 3 PPG) and uploaded his 10,776 Finger glucose data for 2,694 days (from 1/1/2012 to 5/19/2019) on a cloud server.
He borrowed one specific statistical analysis tool, the Candlestick Chart, from the stock market and further modified and customized it for his specific glucose analysis. Usually, a “candlestick” model contains the following five data also known as the OHLC model:
Opening: wake up ~7:00 glucose; Highest: daily maximum glucose; Lowest: daily minimum glucose; Closing: pre-bed ~23:30 glucose; Average: daily average glucose.
However, his Finger Candlestick model’s wake up and pre-bed glucoses are identical since he did not measure his finger glucose at pre-bedtime. This Candlestick model provides four data per day on the same chart instead of the traditional graphic chart of having only one tested data, usually the daily average glucose.
Based on these sets of 10,776 glucose data on the candlestick diagrams (Figure 1 & Figure 2), various glucose patterns and their moving trends can be observed and analyzed through further mathematical and statistical operations. Finally, by using his acquired medical domain knowledge, he then interpreted these mathematical results into biomedical phenomena in order to discover some hidden medical facts and their potential dangers to his health.
The formula of calculating the Effective Glucose is as follows: Annual Effective Glucose = Annual average glucose +
((Glucose >180 -140) *(% of >180) +
(Glucose >140 -140) *(% of >140))
This Effective Glucose in Figure 3 is created to emphasize the “excessive energy” associated with high glucose circulating inside our body which can damage the internal organs by inducing complications from diabetes such as CVD, stroke, thyroid and kidney issues, eye and foot problems.


Table: Key Glucoses of 7.5 Annual Candlestick Diagrams and Effective Glucose

Here are some of his research findings shown in the (Table) and (Figure 3):
His average glucoses are: 130 mg/dL during 2012-2015; 119 mg/dL in 2016; and ~116 during 2017-2019. His T2D conditions have been improving year after year with 2015-2016 as the “Turing Point”
His average Effective glucoses are: 140 mg/dL (~8% increase) during 2012-2015; 123 mg/dL in 2016 (3% increase); and ~119 (~2% increase) during 2017-2019. Although these increased amounts (8% in early years and 2% in recent years) are moderate, their impact may sufficiently increase the risk probabilities of complications.
The daily key glucoses in the Candlestick Diagram and their associated glucose segmentation pattern analysis indeed bring in extra capabilities for the author to conduct a better view of the glucose trend and to discover more hidden facts of glucoses and diabetes complications.
This paper has further demonstrated the power of the GHMethod: math-physical medicine. It utilizes observation of the physical phenomena of glucose, derivation of mathematical equations, application of computer technology, and finally combined with biomedical domain knowhow for further medical interpretations in order to discover and predict more hidden biomedical facts regarding the human body.